Dashboard Overview
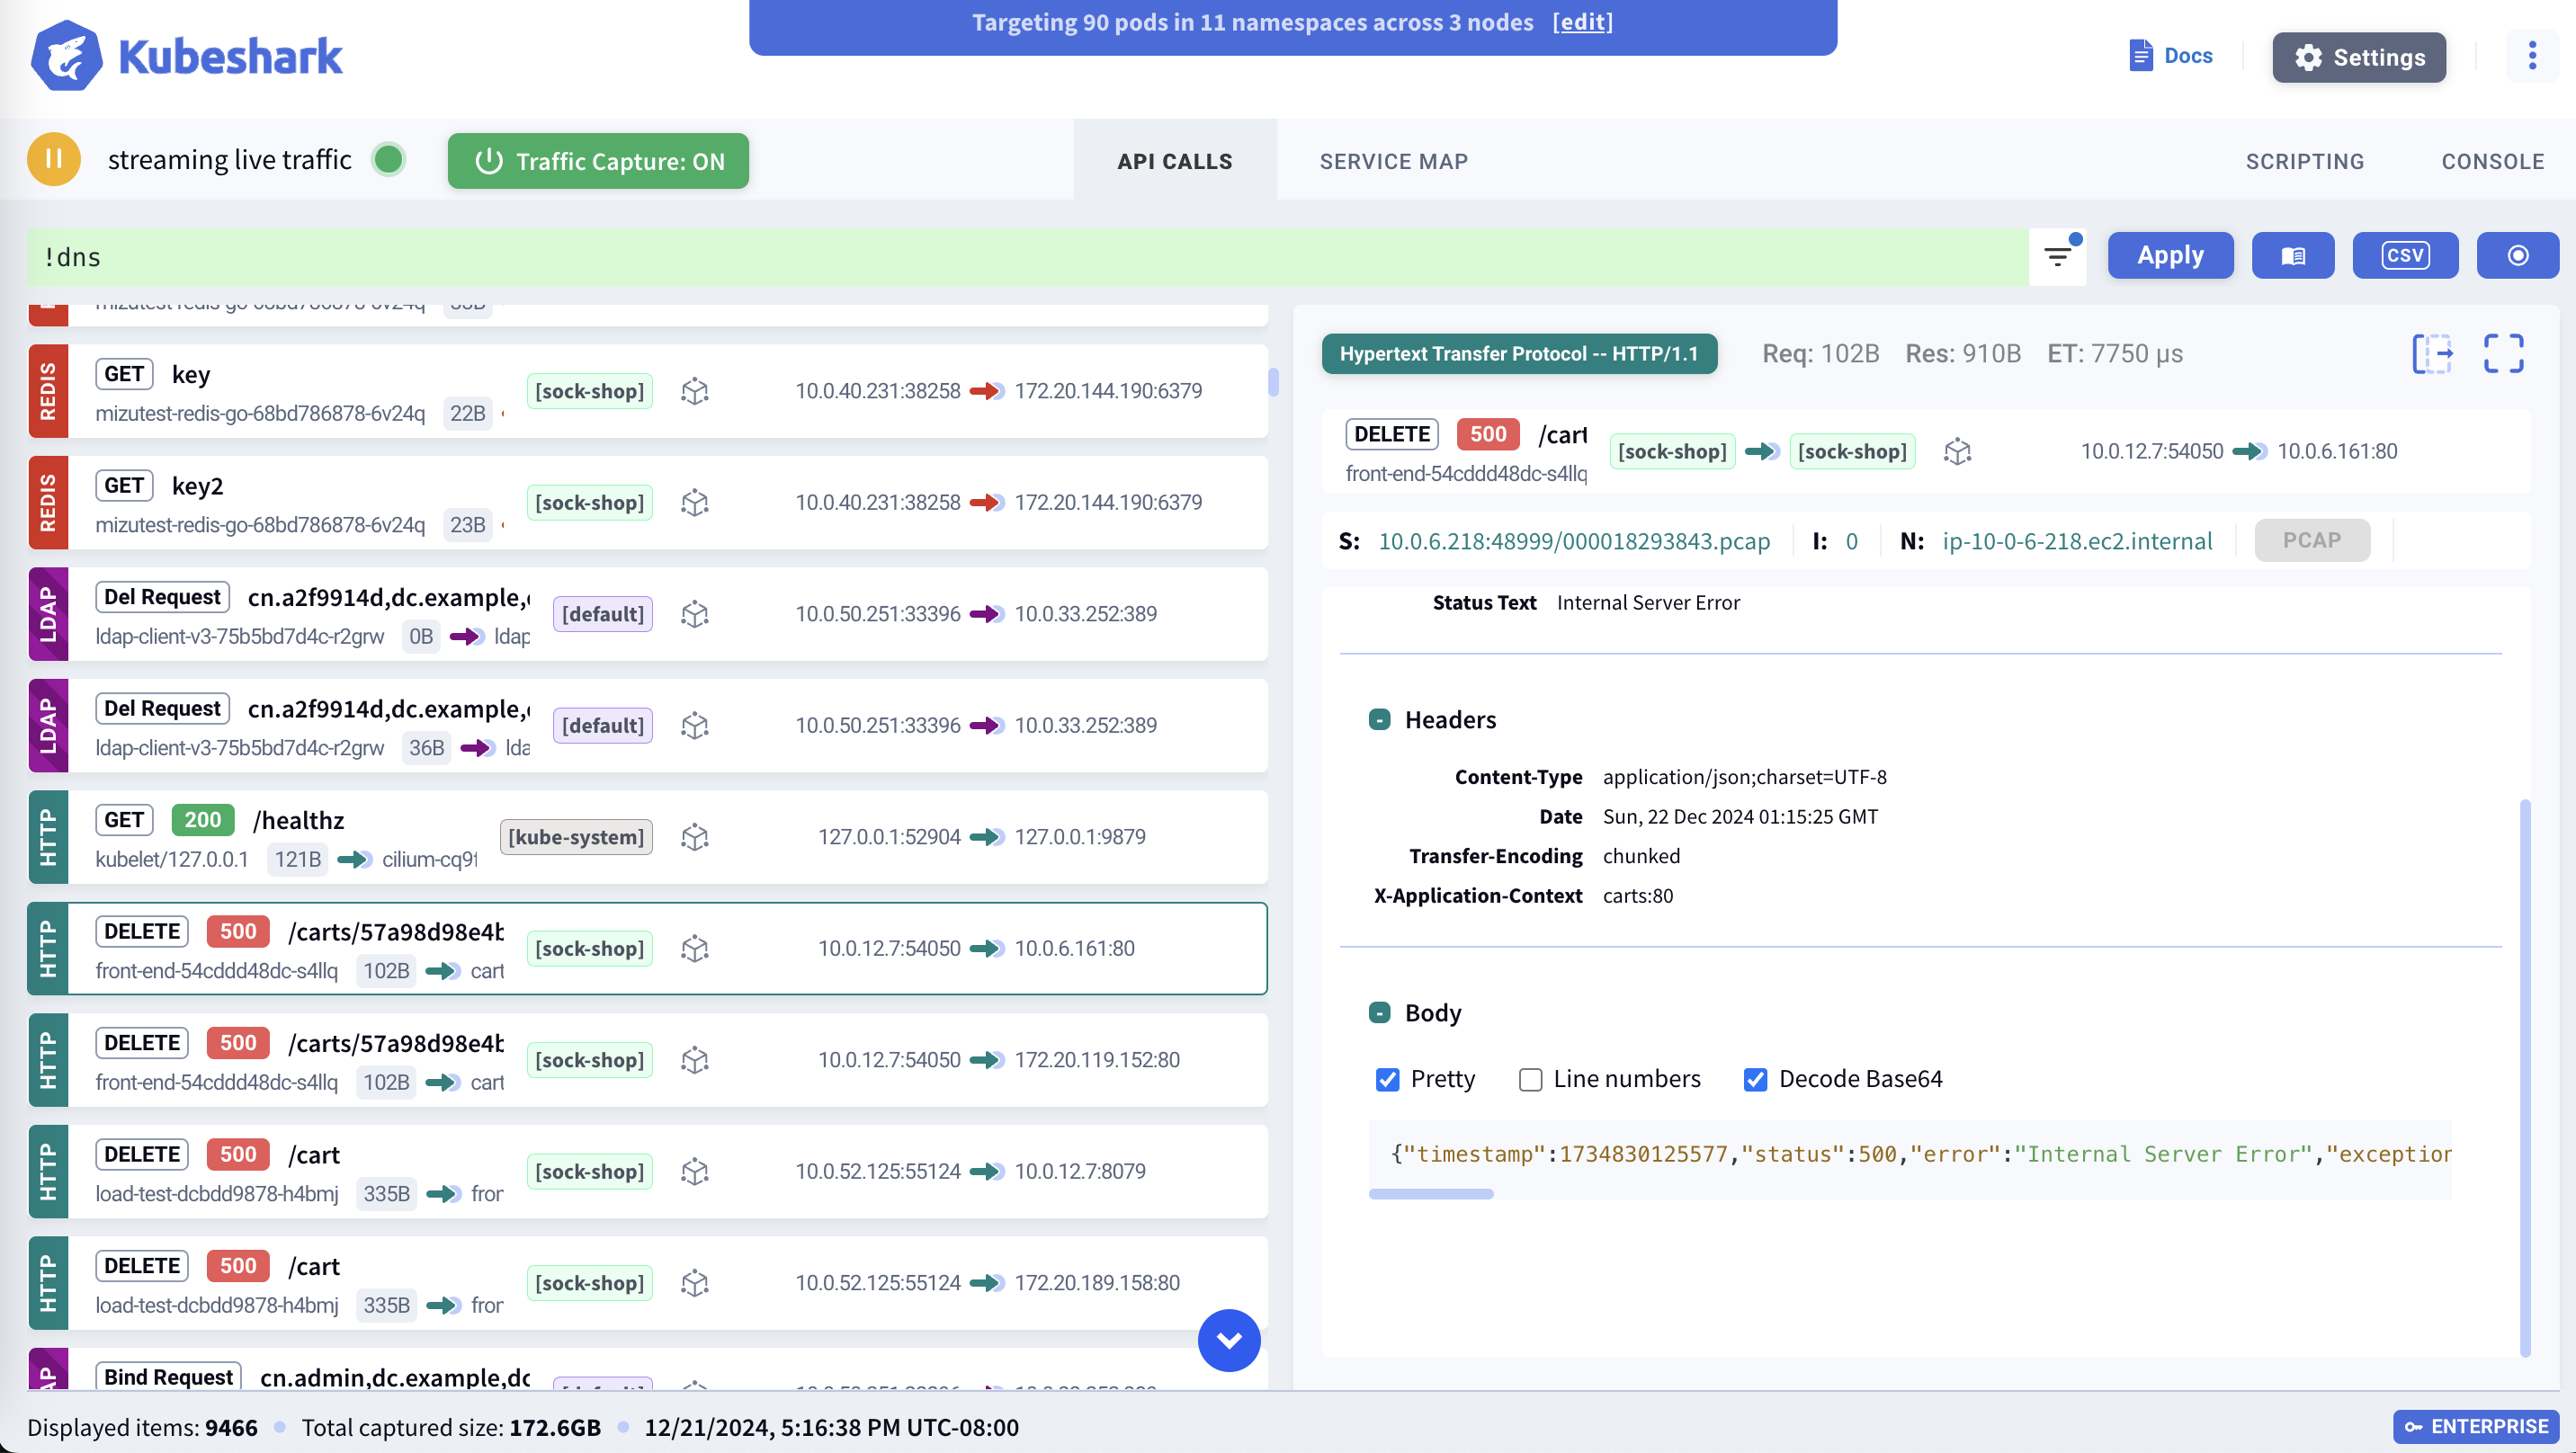
The Kubeshark Dashboard provides a centralized interface for viewing, filtering, and analyzing Kubernetes network traffic. It displays real-time API streams, workload relationships, and traffic snapshots—all enriched with full Kubernetes context.

API Stream
The L7 API Stream displays cluster-wide API calls in real-time, or when viewing delayed dissected snapshots. Each call includes full Kubernetes context, operating system context, API metadata, and network payload.

The stream will be empty if API Dissection is disabled.
See L7 API Stream for details on stream entries, filtering, and entry details.
Display Filters / KFL
Display Filters use KFL2 (Kubeshark Filter Language 2) to control what traffic appears in the API stream. Filter by protocol, status code, Kubernetes identity, headers, and more.
# HTTP errors
http && status_code >= 400

# Traffic to production
dst.pod.namespace == "production"
Display filters affect only the current browser tab. Multiple tabs can show different filtered views of the same cluster.
See Display Filters / KFL for usage details and KFL2 Reference for complete syntax.
Workload Maps
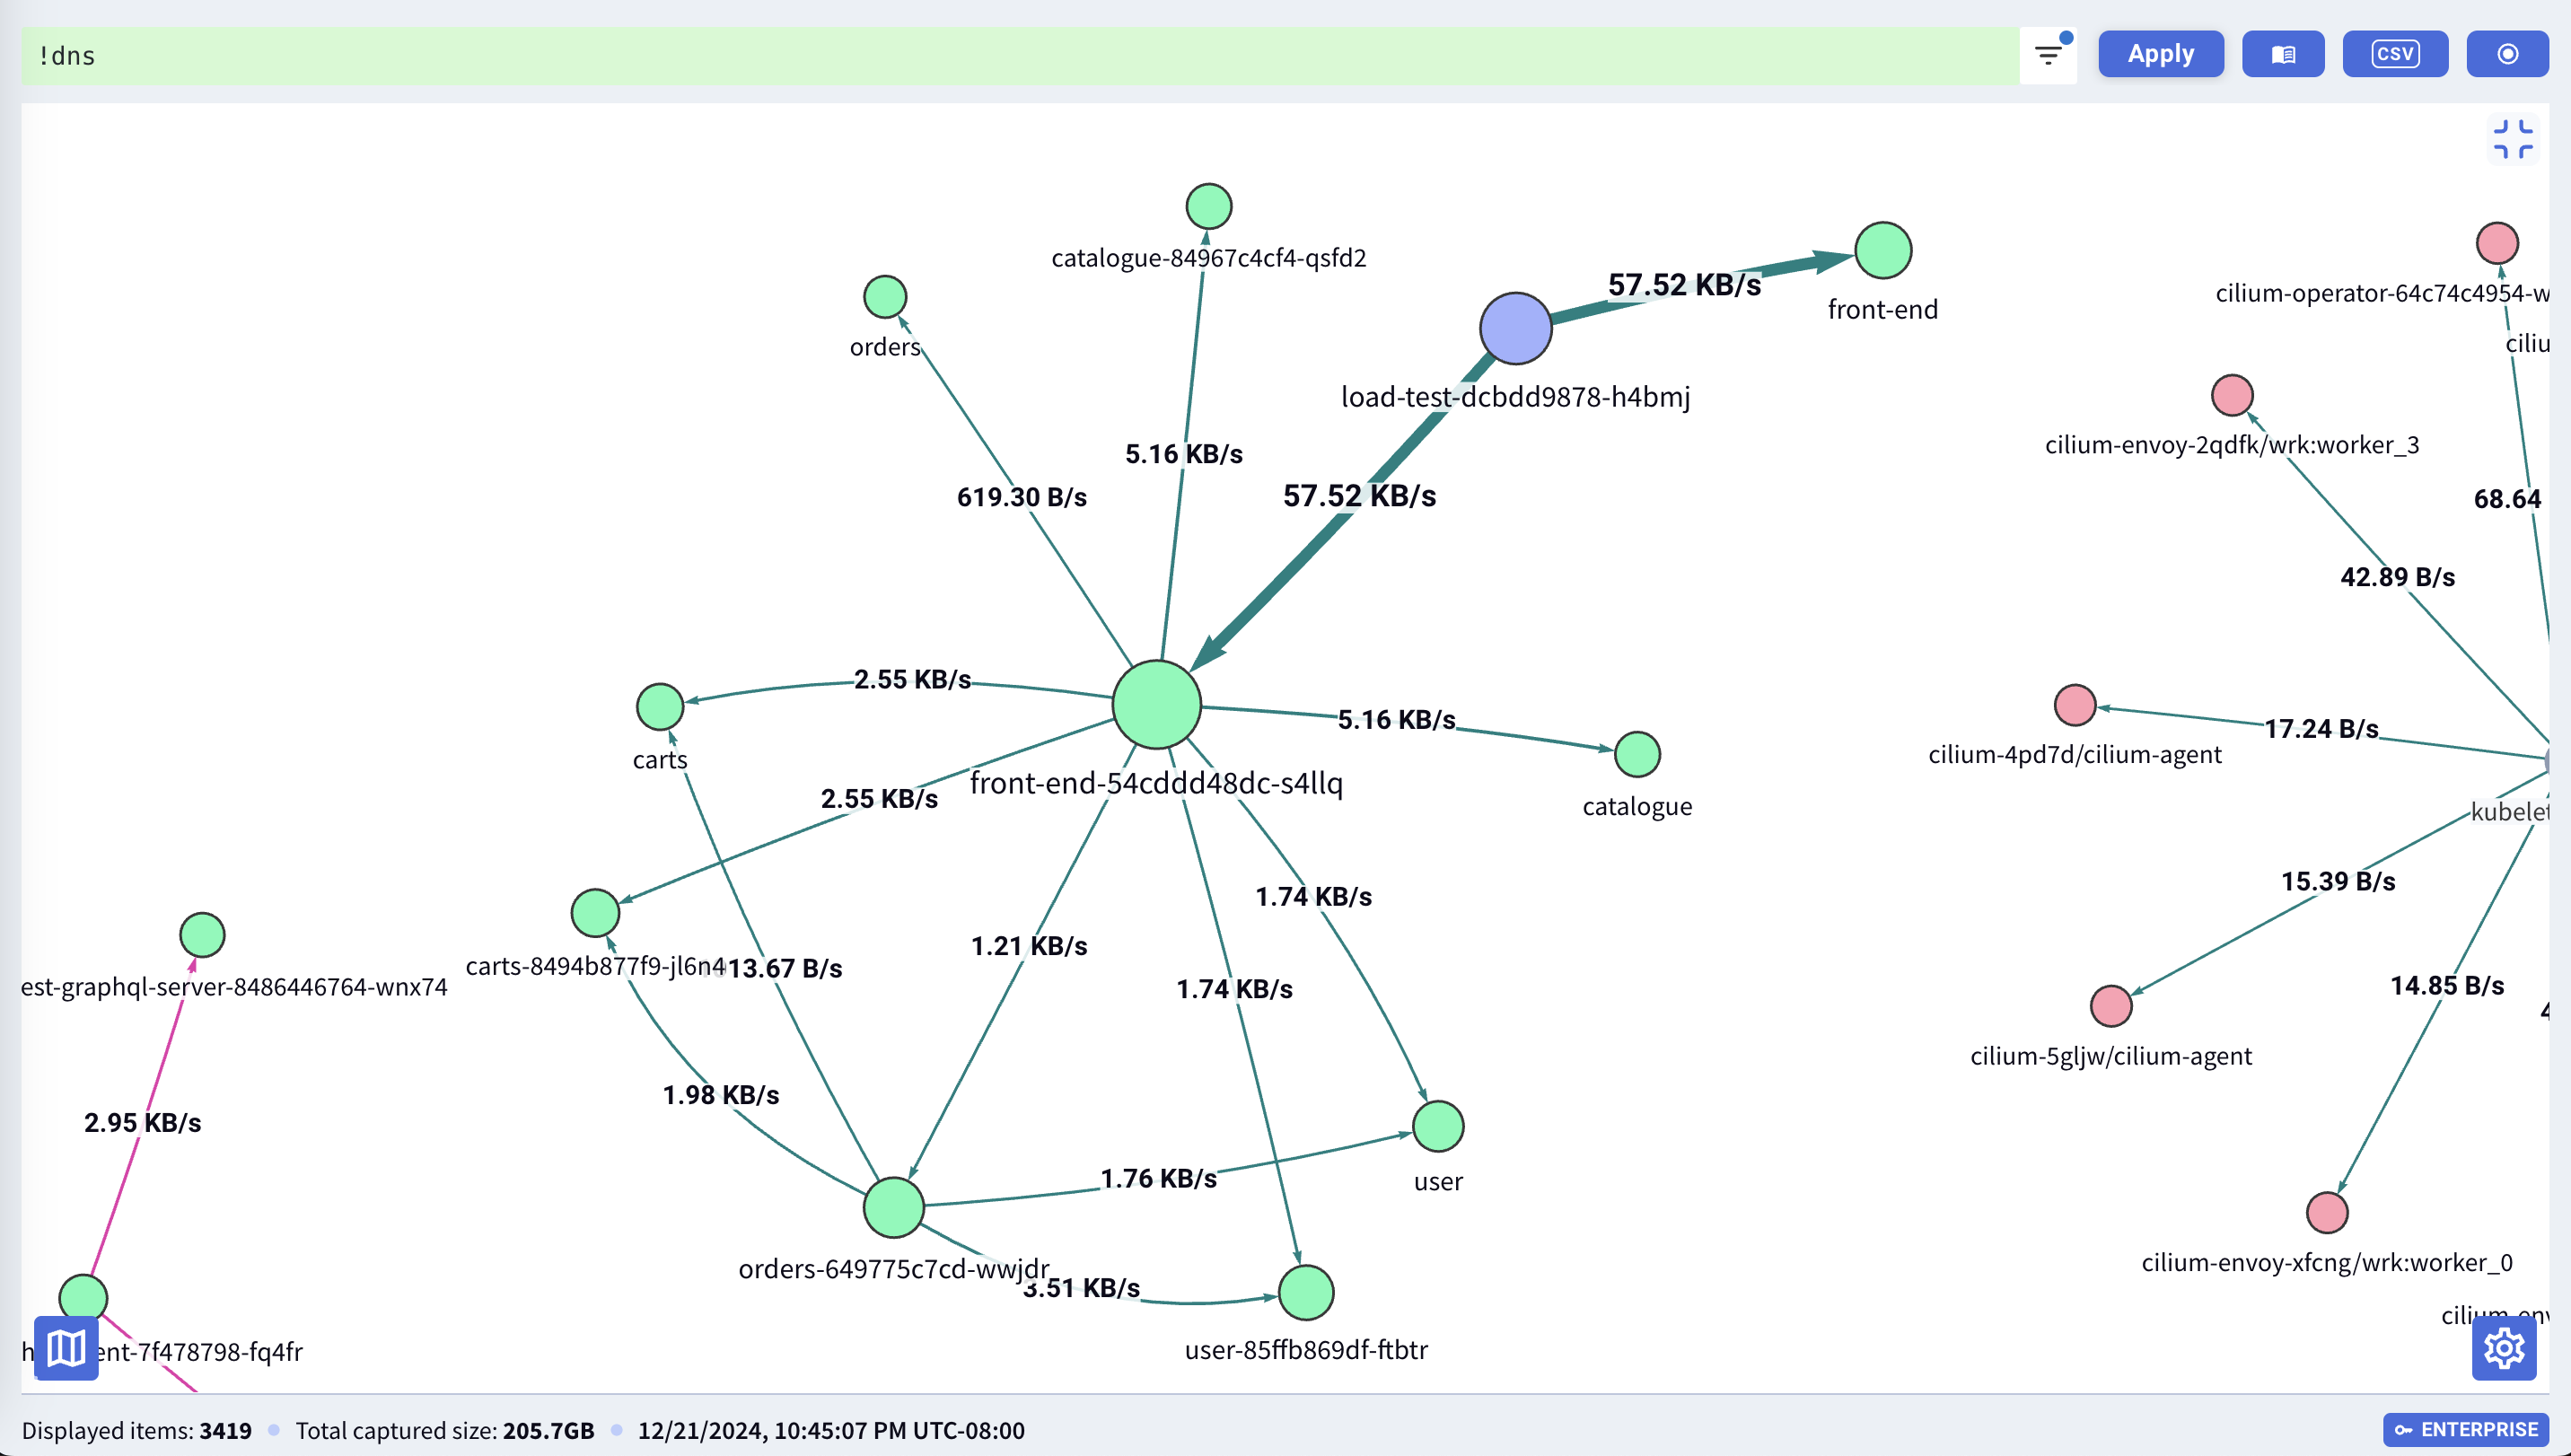
The L4/L7 Workload Map provides a real-time visualization of traffic dependencies within the cluster.

The map updates live and can be filtered to show specific namespaces, services, or traffic patterns.
Snapshots
Access and manage Traffic Snapshots from the dashboard. Create new snapshots, browse existing ones, and run Delayed Dissection on captured traffic.
See Snapshots for details.
Targeted Pod List
The Targeted Pod List shows all pods currently being captured based on Capture Filters. Only traffic from these pods appears in the API stream.

See Targeted Pod List for details.
Settings
The Settings panel provides access to dashboard configuration, capture filter controls, and display options.
See Settings for details.
Ingress
Configure external access to the dashboard. See Ingress for detailed setup instructions including:
- Kubernetes Ingress resources
- TLS configuration
- Authentication integration
What’s Next
- Display Filters (KFL2) — Filter syntax reference
- L4/L7 Workload Map — Dependency visualization
- Traffic Snapshots — Capture historical traffic